
Fixed route transit agencies typically have timetables defining the daily schedule of their buses. To make route information available of Google Maps, transit agencies must conform their data to the General Transit Feed Specification (GTFS).
I created a GTFS schedule for University of Wyoming's bus service using:
- Python for data engineering and
- React for visualization
This post is a brief overview of the project, and more detailed information will be soon available in the Projects tab of this blog, or at Introduction to the General Transit Feed Specification.
Motivation
With this new blog, I needed some projects to write about. Being a bus driver for University of Wyoming, publishing their data to Google Maps is something I've been wanting to do for a while. In fact, last year I spent months developing an awesome full-stack web app for creating and publishing route timetables called SmallTown Transit.
The app ended up being a never-ending project and was a huge lesson in Agile development (Check out the Agile Manifesto if you are unfamiliar with Agile).
I aimed in this project to have a shippable product in two weeks, and that's what I did.
Outline
Clean the existing timetables. UWYO's timetables are Excel documents that are made to be human-readable. I created standardized CSV documents where every cell is plain text because this would be easier to manage with Python.
Write a Python script for creating the feed. Some of the txt files in the feed are manually created, while others like trips.txt, stop_times.txt, and shapes.txt lend themselves to being programmatically generated.
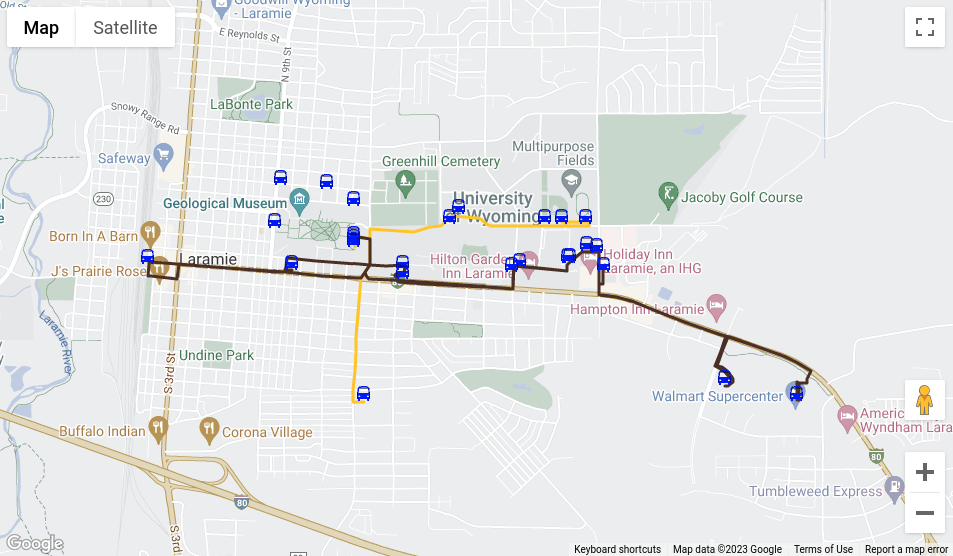
Create a quick React app to view and check the data for accuracy. Using the Google Maps API, I am able to view the stop locations and route shapes.
Cleaning the Timetables
I started the project with timetables from the transit department. These show a leave time for every bus stop along a route.
The original tables
In the original timetables columns are stops ('Downtown' and 'East Lot'), rows are trips (one lap around a route), and cells are stop times ('6:30 AM at Downtown'). See the picture below.
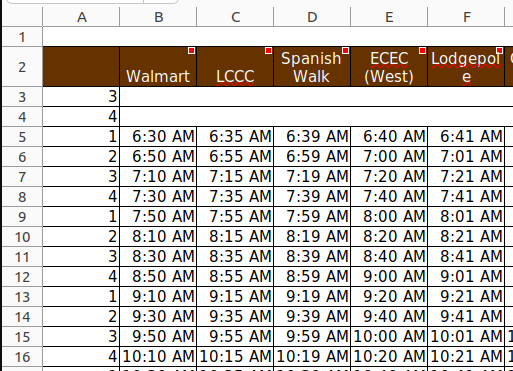
These provided timetables are great for human readability as well as recalculating times. The cells are variously colored, merged, and contain plain text, numbers, and calculations.
I needed to:
- Flatten these tables into standard, 100% plain text CSV files.
- Replace stop names ('Walmart') with stop IDs ('WM') so that I could reference a stops.txt table.
- Add information about stop types (ie. can passengers board here? Do passengers need to notify the driver to stop here?). This required insight into how the department and routes work, as this information is not included in their timetables.
The formatted table
| WM | LCCC | SPW | ECEC | ... |
|---|---|---|---|---|
| 06:30:00 | 06:35:00 | 06:39:00 | 06:40:00! | ... |
| 06:50:00 | 06:55:00 | 06:59:00 | 06:40:00! | ... |
| ... | ... | ... | ... | ... |
The exclamation mark designate a stop request: A stop where passengers must get the driver's attention (typically by pulling the stop request cord).
I likewise used the question mark and pipe to designate an interpolated timepoint and a do-not-board stop respectively.
More symbols could be added, but these few allowed for the layers of information I needed.
Writing a Python Script
I chose to use Python to create the GTFS feed. I used a Jupyter Notebook for quick development and integrated documentation.
The main purpose of the Python script is to convert formatted timetables to the CSV files required by the GTFS. The below tables demonstrates the transition from timetable to stop_times and trips. The tables are simplified versions of the files required by GTFS. Notice how each timetable row gets a row in trips.txt and each cell gets a row in stop_times.txt
Python script input (simplified)
link_timetable.csv
| WM | UN | DTN | UN | WM |
|---|---|---|---|---|
| 06:30:00 | 06:45:00 | 07:00:00 | 07:15:00 | 07:30:00 |
| 07:30:00 | 07:45:00 | 08:00:00 | 08:15:00 | 08:30:00 |
Python script output (simplified)
| route_id | trip_id |
| L | L0 |
| L | L1 |
| trip_id | stop_time | stop_id | stop_type |
|---|---|---|---|
| L0 | 06:30:00 | WM | 0 |
| L0 | 06:45:00 | UN | 0 |
| ... | ... | ... | ... |
| L1 | 06:30:00 | WM | 0 |
| L1 | 06:45:00 | UN | 0 |
| ... | ... | ... | ... |
Python script other tasks
Beyond creating stop_times.txt and trips.txt, the Python script also handles:
Importing all necessary data files (stops.xlsx, routes.xlsx, agency.xlsx, etc.), processing data if necessary, and exporting them as .txt files.
Generate shapes.txt using Google Maps Directions API. shapes.txt is used to display a colored line for a given route on Google Maps. Directions API returns an encoded polyline which must be decoded. Luckily, there is a Python package for this.
Creating a React App for Viewing and Verifying GTFS
The React App I built can be found on this site at the GTFS Viewer. If you don't have a GTFS feed, look at the screenshots below from the GTFS Viewer. For the app, I used MDX, the combination of markdown and JSX that allows for directly using React components in markdown files.
Viewing route shapes and stop locations
Viewing stop times by stop
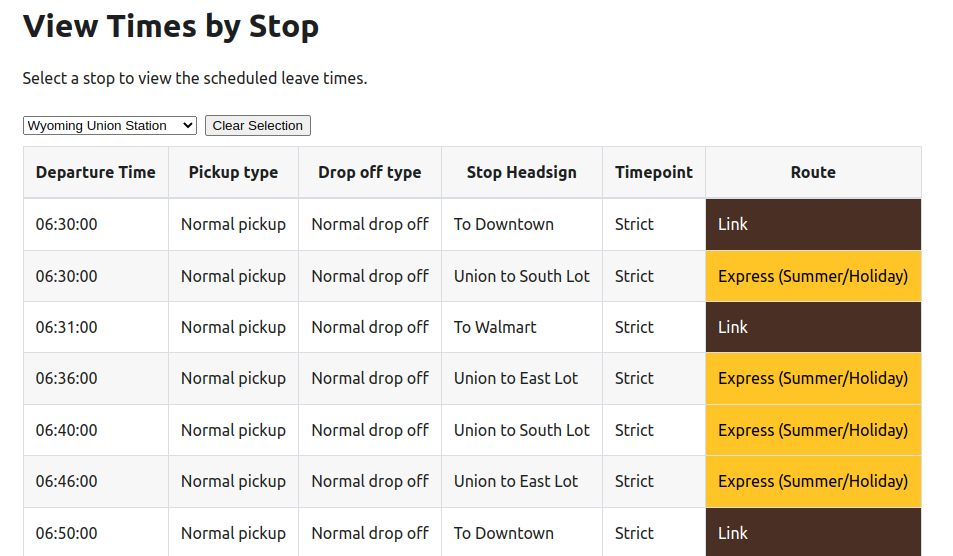
This app ended up being helpful not only for viewing and verifying data, but also showing the transit agency their data in a way that is easy to visualize.
Final Thoughts
I enjoyed building this project. My department is still in the process of applying to be a Google Transit Partner, but before long, this data should be visible on Google Maps.
Thanks for stopping by, and watch out for more posts soon!